Network management products
Mon-A-Co Centro
Turn-key monitoring and observability for common satcom paradigms
Learn more about Mon-A-Co Centro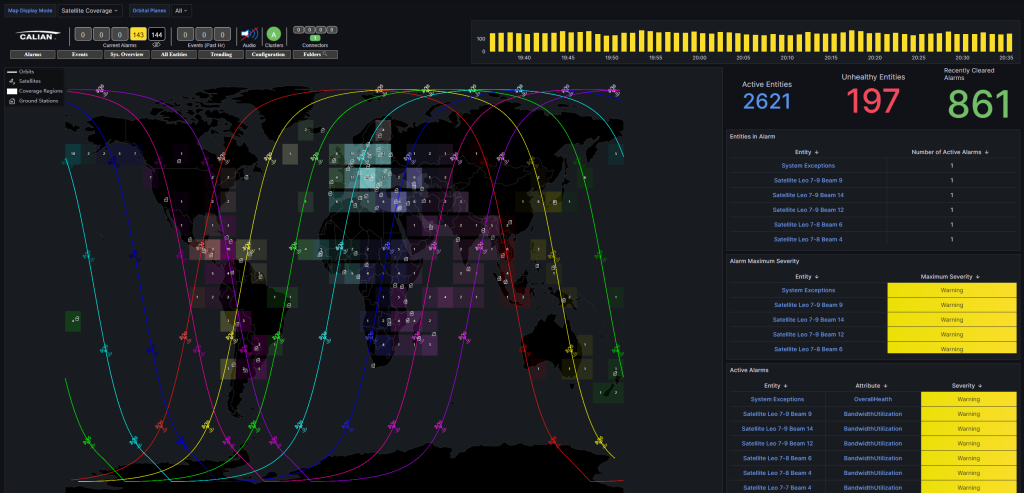
High-level observability of the ground, user and space segments
Mon-A-Co Centro is the latest addition to the Mon-A-Co family of monitor and control products. Centro is built upon the flexible infrastructure of the Calian Centralized Management Platform (CMP).
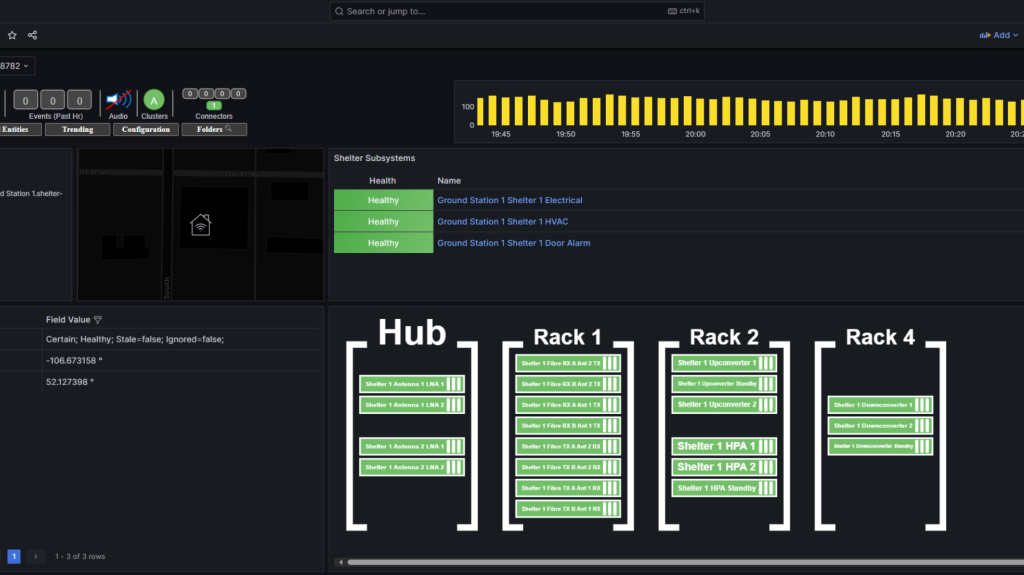
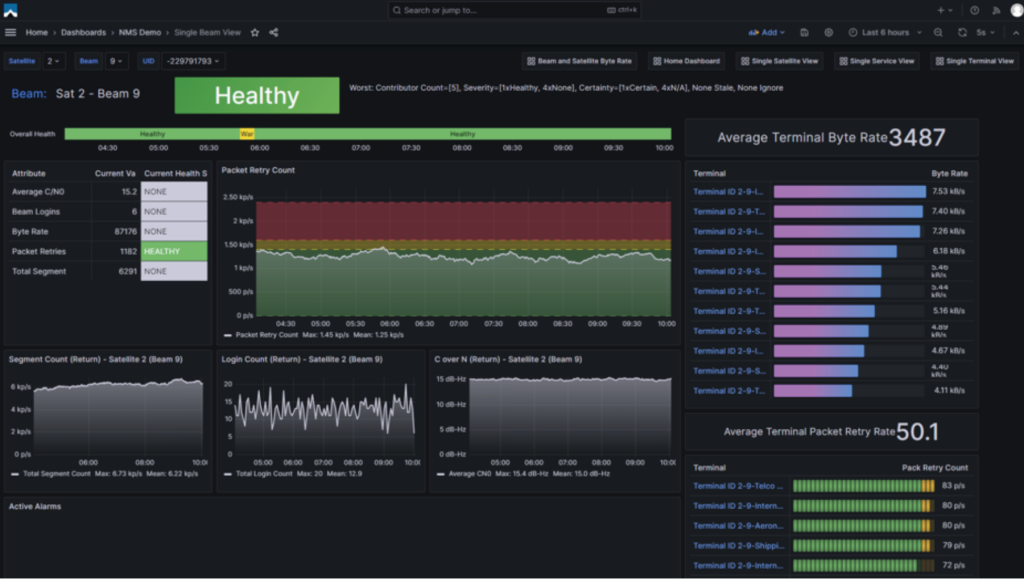
Paradigms in Centro are focused on supporting personnel at the NOC and pertain to high-level observability of the ground, user, and space segments. The paradigms cover concerns such as overall network health, performance bottlenecks, efficiency, SLAs, traffic distribution and more. The list of paradigms supported by Centro will continue to expand over time.
Download PDFParadigms in Centro are focused on supporting personnel at the NOC and pertain to high-level observability of the ground, user, and space segments. The paradigms cover concerns such as overall network health, performance bottlenecks, efficiency, SLAs, traffic distribution and more. The list of paradigms supported by Centro will continue to expand over time.
While the CMP provides a comprehensive infrastructure for building a wide array of network management systems, Centro is more focused in its objective of providing a refined set of features to support monitoring and observability for common satcom paradigms.
Mon-A-Co Centro
Expandable and configurable
Provided the data is available, new paradigms can be added to existing Centro systems with relative ease. Centro can also be expanded by users to add additional modeling for ingested and derived data, allowing further support for more sophisticated networks.
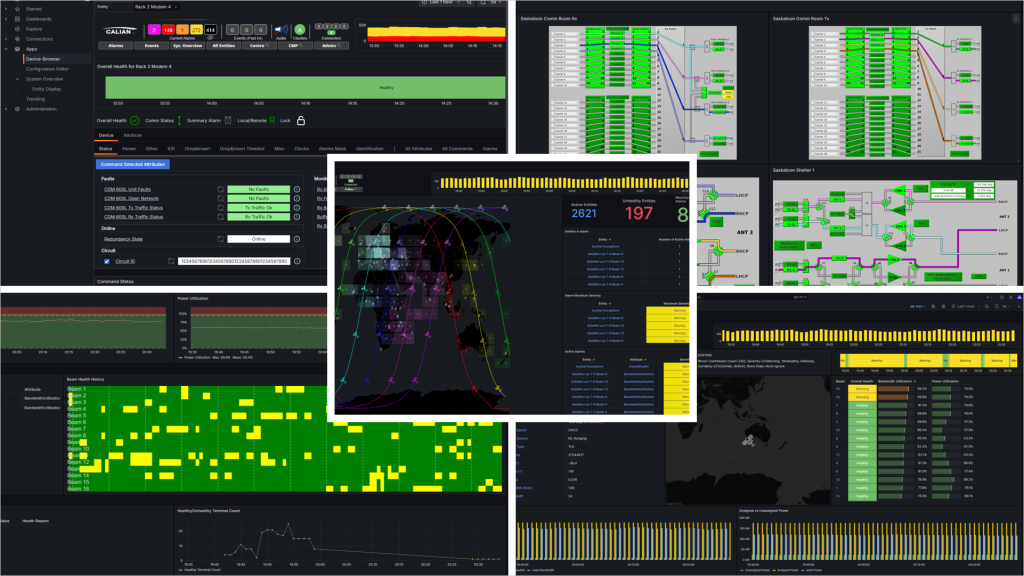
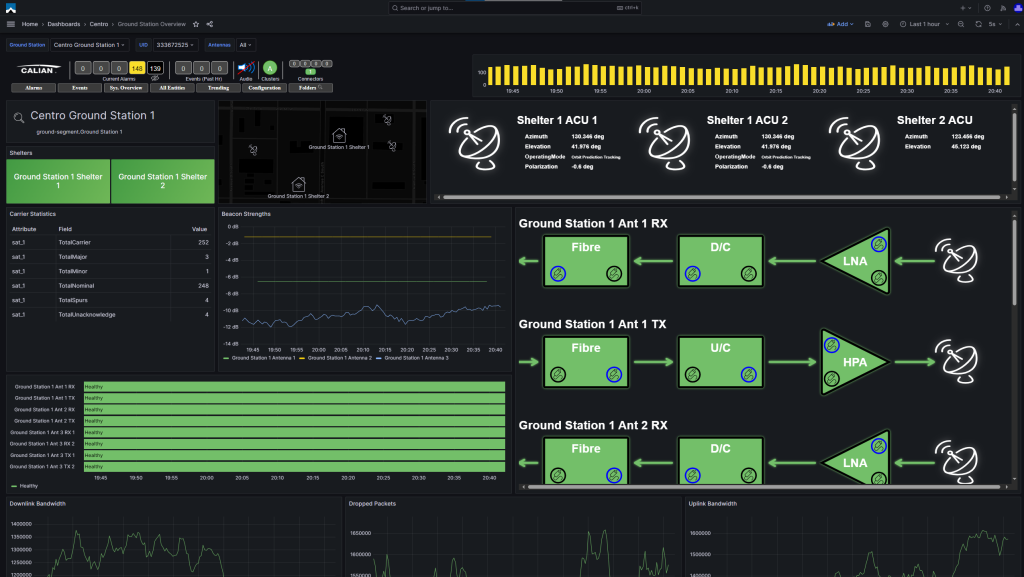
- Each Centro paradigm provides a paradigm-specific data model and dashboards.
- Configuring the appropriate data connector to ingest data from the network elements and convert it into the data expected by the data model, allows the model and dashboards to function without further effort.
- Paradigm data models may be both static and dynamic, where dynamic models can adapt in near real time to changing system data.
Key features
Core features inherited from CMP
- Informative, rich, web-based dashboards
- Feature-rich data graphing and trending
- User-configurable data aggregation, derivation and organization
- Events for significant occurrences
- Alarms for all data with health status
- A commanding engine with command initiation and command tracking functions
- Standards-based mechanisms utilizing OAuth2, TLS, managed certificates, encryption and more
- Supports bare metal, private and public cloud installations
- Pairwise and clustered high-availability options
- Out-of-the-box integration with Mon-A-Co Edge
- Connectors for over 250 protocols, including REST, SNMP, and Kafka
- X, Y and Z-axis scaling
- Northbound user APIs
Standard paradigms for NOC overview
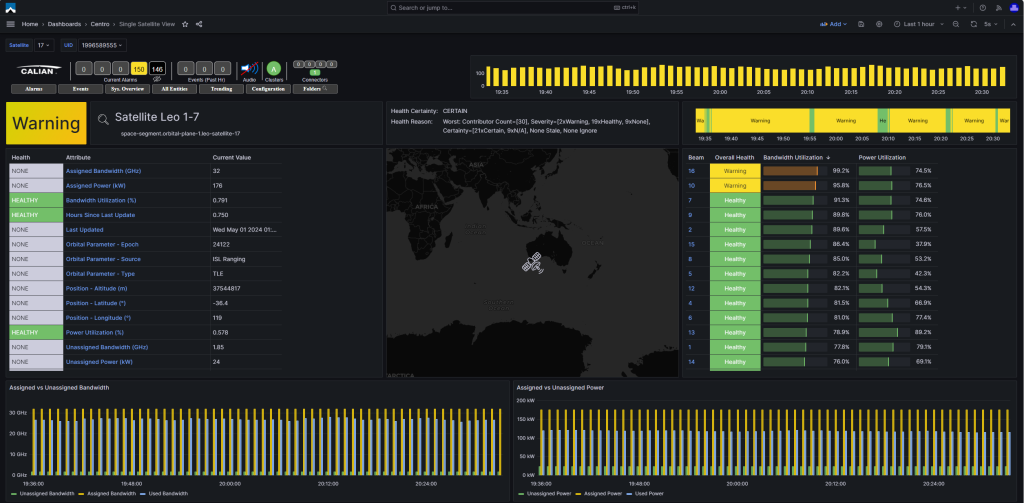
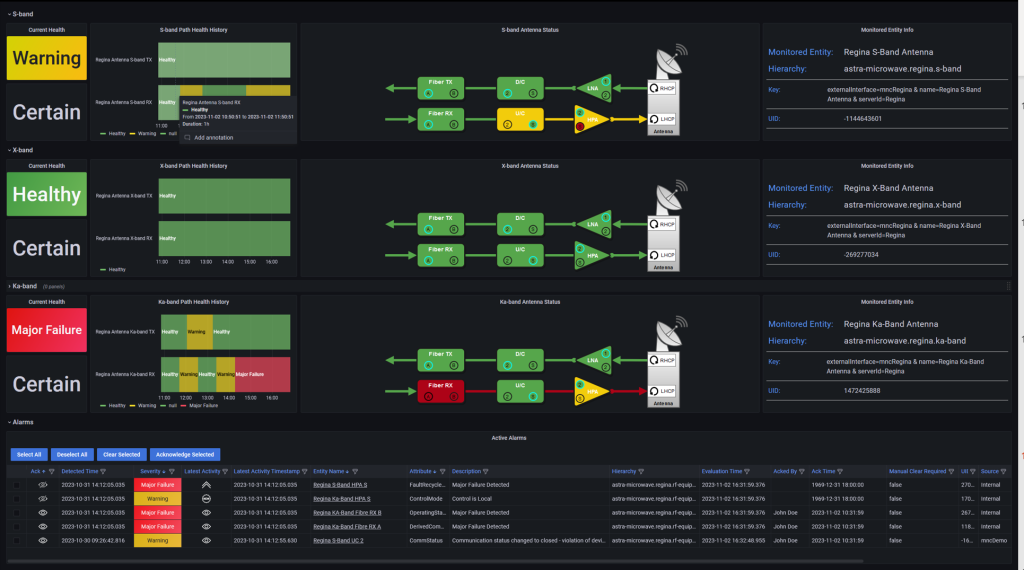
- Domain-specific data models and hierarchies for the paradigm.
- Custom views and dashboards to best support the paradigm and data model.
- Pre-canned configuration specific to the paradigm.
- Supports paradigms related to RF chains, user services, satellite capacity and others.
Provides value out-of-the-box
- Integration APIs/connectors, templates, and data mapping makes integration easy.
- Connect to your network elements and let Centro do the rest.
- Default dashboards provide detailed and comprehensive observability with little effort required.


Talk to a Calian expert today
Reach out to learn how our innovative solutions can help you solve your most complex challenges.
Loading…
